Understanding the Building Complexity Score: a smarter way to assess structural risk


ShaneBlack
In a world where data-driven decisions are reshaping how we manage physical assets, the Building Complexity Score offers a fresh, quantifiable lens to evaluate one of the most overlooked aspects of property risk: geometric complexity.
Whether you're an insurer estimating rebuild costs, a mortgage lender assessing portfolio risk, or a physical assets manager prioritising maintenance budgets, understanding the shape of a building can reveal more than meets the eye.
What is the Building Complexity Score?
The Building Complexity Score is a composite metric that quantifies how geometrically intricate a building’s footprint is. In simple terms, it tells you how “complicated” a building’s shape is, based on its outline, symmetry, and structural features.
This isn’t just academic. Complex buildings tend to be more expensive to rebuild, harder to repair, and more vulnerable to damage. By assigning a score to this complexity, stakeholders can make smarter, faster decisions about risk, cost, and resource allocation.
Who is it for?
This score is particularly valuable for:
- Insurers: To estimate rebuild costs and assess structural risk.
- Mortgage lenders: To evaluate the physical risk profile of properties in their portfolios.
- Physical asset risk managers: To prioritise inspections, maintenance, and capital planning.
- Urban planners and property analysts: To identify non-standard buildings or architectural outliers.
- Data scientists: To use complexity as a feature in predictive models.
Why do you need it?
Traditional property assessments often overlook the shape of a building. Yet, geometric complexity can be a strong proxy for:
- Higher rebuild costs: Irregular shapes require more materials and labour.
- Structural vulnerabilities: Complex outlines may indicate weak points or design inefficiencies.
- Repair challenges: Asymmetry and fragmentation complicate restoration efforts.
- By integrating the Building Complexity Score into your workflows, you gain a standardised, scalable way to assess physical risk, without needing to inspect every building manually.
How does it work?
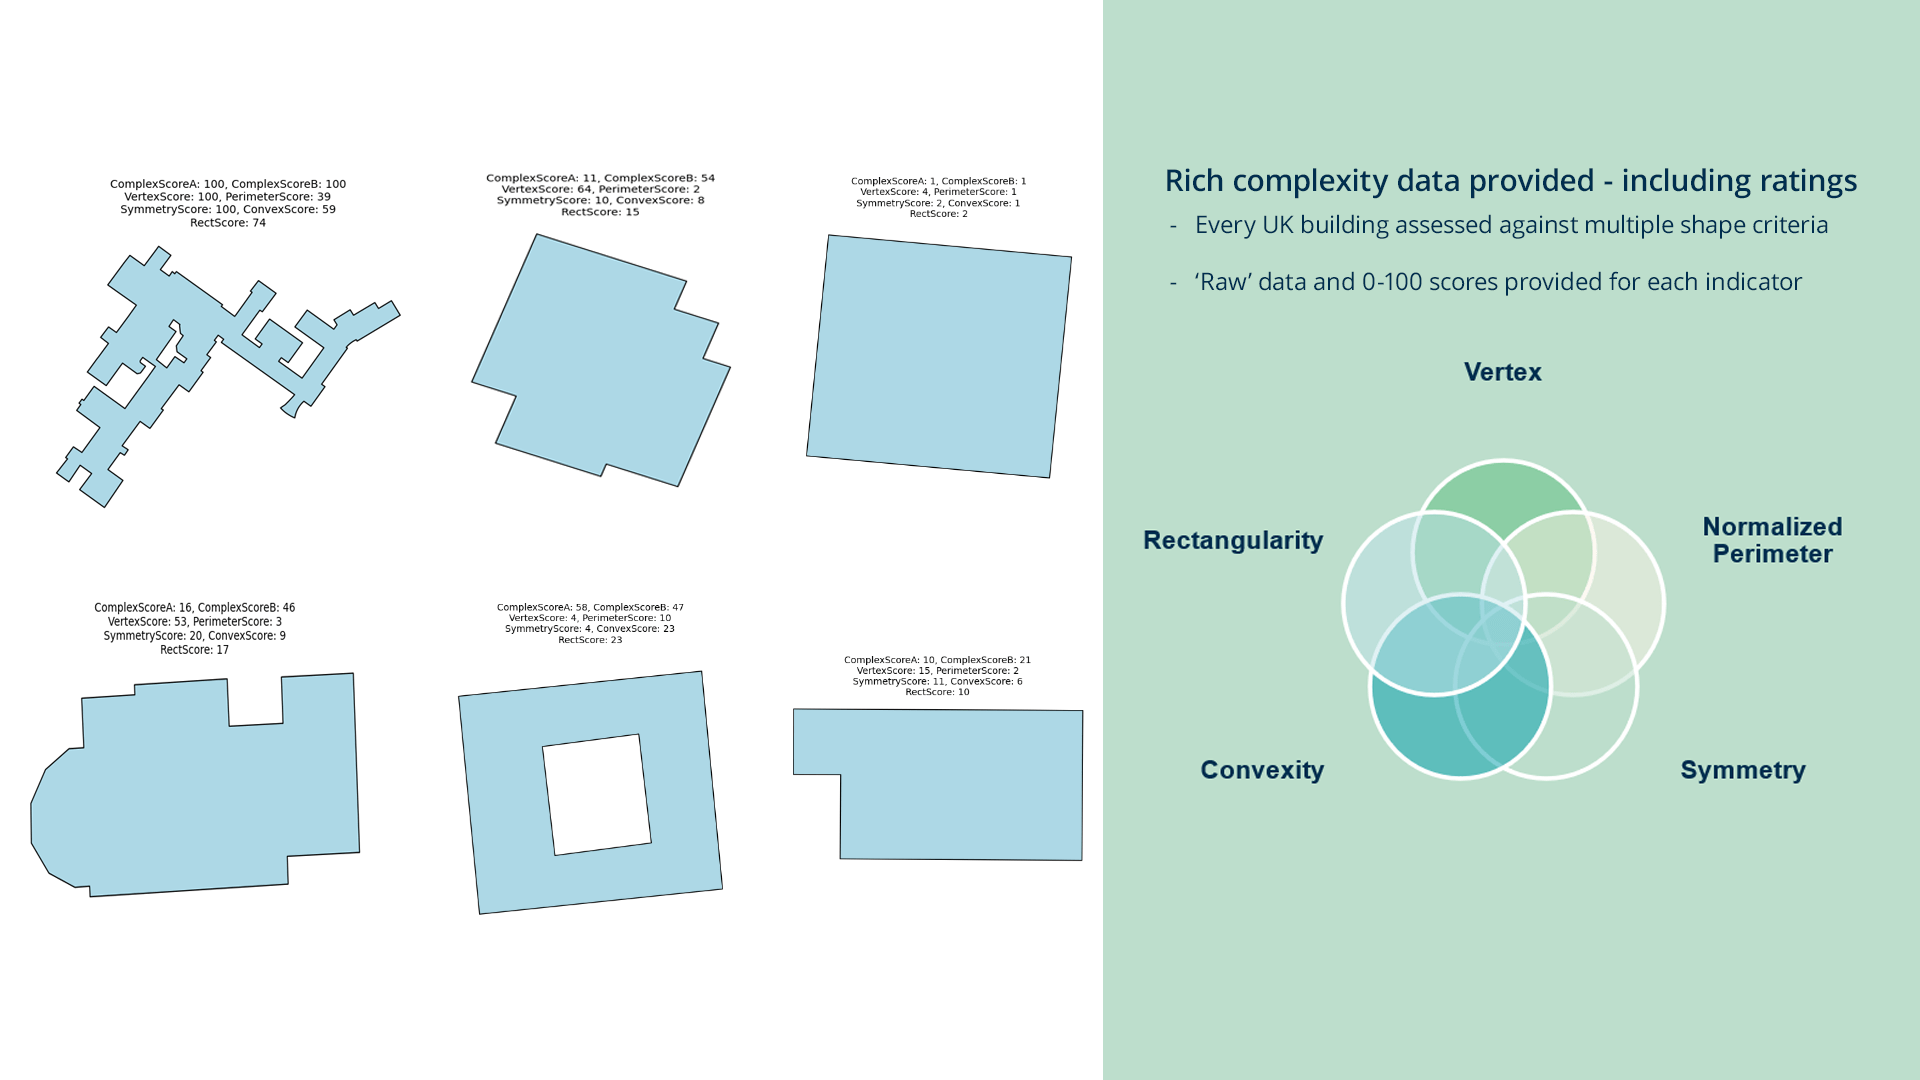
The score is built from multiple core geometric analyses, each capturing a different aspect of complexity:
- Normalised Perimeter
This metric compares the perimeter of a building to the square root of its area. A compact shape like a square will score low, whereas a fragmented or irregular shape will score high. - Rectangularity - measures how closely a building resembles a rectangle. Indentations and outcrops reduce this score, indicating higher complexity.
- Convexity assesses how “filled out” a shape is by comparing its area to its convex hull. Concave shapes (with indentations) score lower.
- Symmetry Score: uses the Hausdorff distance to compare a building to its mirrored version. Asymmetric buildings score higher, indicating complexity.
- Number of Vertices - counts the corners in a building’s outline. More corners usually mean more complexity, though the metric is capped to avoid skew from highly fragmented shapes.
Composite scores for simplicity
To make the data easier to interpret, two composite scores are offered:
- Two-Metric Score: Combines Normalised Perimeter and Convexity. This score is perfect for making quick comparisons with minimal data.
- Four-Metric Score: Combines Normalised Perimeter, Convexity, Symmetry Score, and Number of Vertices. Offers a more nuanced view, scaled from 1 (very simple) to 100 (highly complex).
These scores are normalised and capped to ensure consistency across datasets, making them suitable for large-scale analysis and integration into existing risk models.
What's its value?
Let’s say you’re an insurer evaluating two properties with similar square footage. One is a simple rectangular bungalow; the other is a sprawling, asymmetrical structure with multiple wings and indentations. Without a complexity score, they might look the same on paper. But in reality, the second building could cost significantly more to rebuild and carry higher risk.
The Building Complexity Score helps you see beyond the surface, offering a data-backed way to:
- Flag high-risk properties.
- Refine underwriting models.
- Prioritise inspections and maintenance.
- Enhance portfolio-level risk assessments.
Real-World Applications
Here’s how different sectors are already using the score:
- Insurance: To adjust premiums based on rebuild complexity.
- Mortgage lending: To identify properties that may pose higher physical risk.
- Urban planning: To detect unusual or non-standard buildings.
- Data science: To improve predictive models for damage, cost, or risk.
- Advanced use cases include clustering buildings by complexity, identifying architectural styles, and flagging anomalies in large datasets.
Looking ahead
The current scoring system is based on heuristic reasoning and empirical observations. All metrics contribute equally, but future iterations may introduce weighted combinations based on predictive performance. This opens the door to even more accurate and tailored risk assessments. In an era of climate uncertainty, ageing infrastructure, and rising rebuild costs, the Building Complexity Score offers a simple yet powerful tool to help stakeholders make smarter decisions. It’s not just about geometry; it’s about understanding the hidden risks that shape our built environment.If you're ready to integrate complexity scoring into your risk models or property analytics, get in touch with our team at Haskoning or via your preferred supplier. We’ll help you unlock the insights hidden in your building footprints.
Discovermore
Request sample data to see how climate risk data analytics can help your business
More on climate intelligence innovations
 Water
WaterBoost property risk insights with our new site-link service for enhanced site visibility

 Digital
GB Erosion Score the future of coastal risk intelligence
 Digital
Subsidence the hidden risk to your UK property portfolio
 Water
Water