Flood vulnerability factors for smarter risk modelling

SamaneSharifi Monfared
What is it?
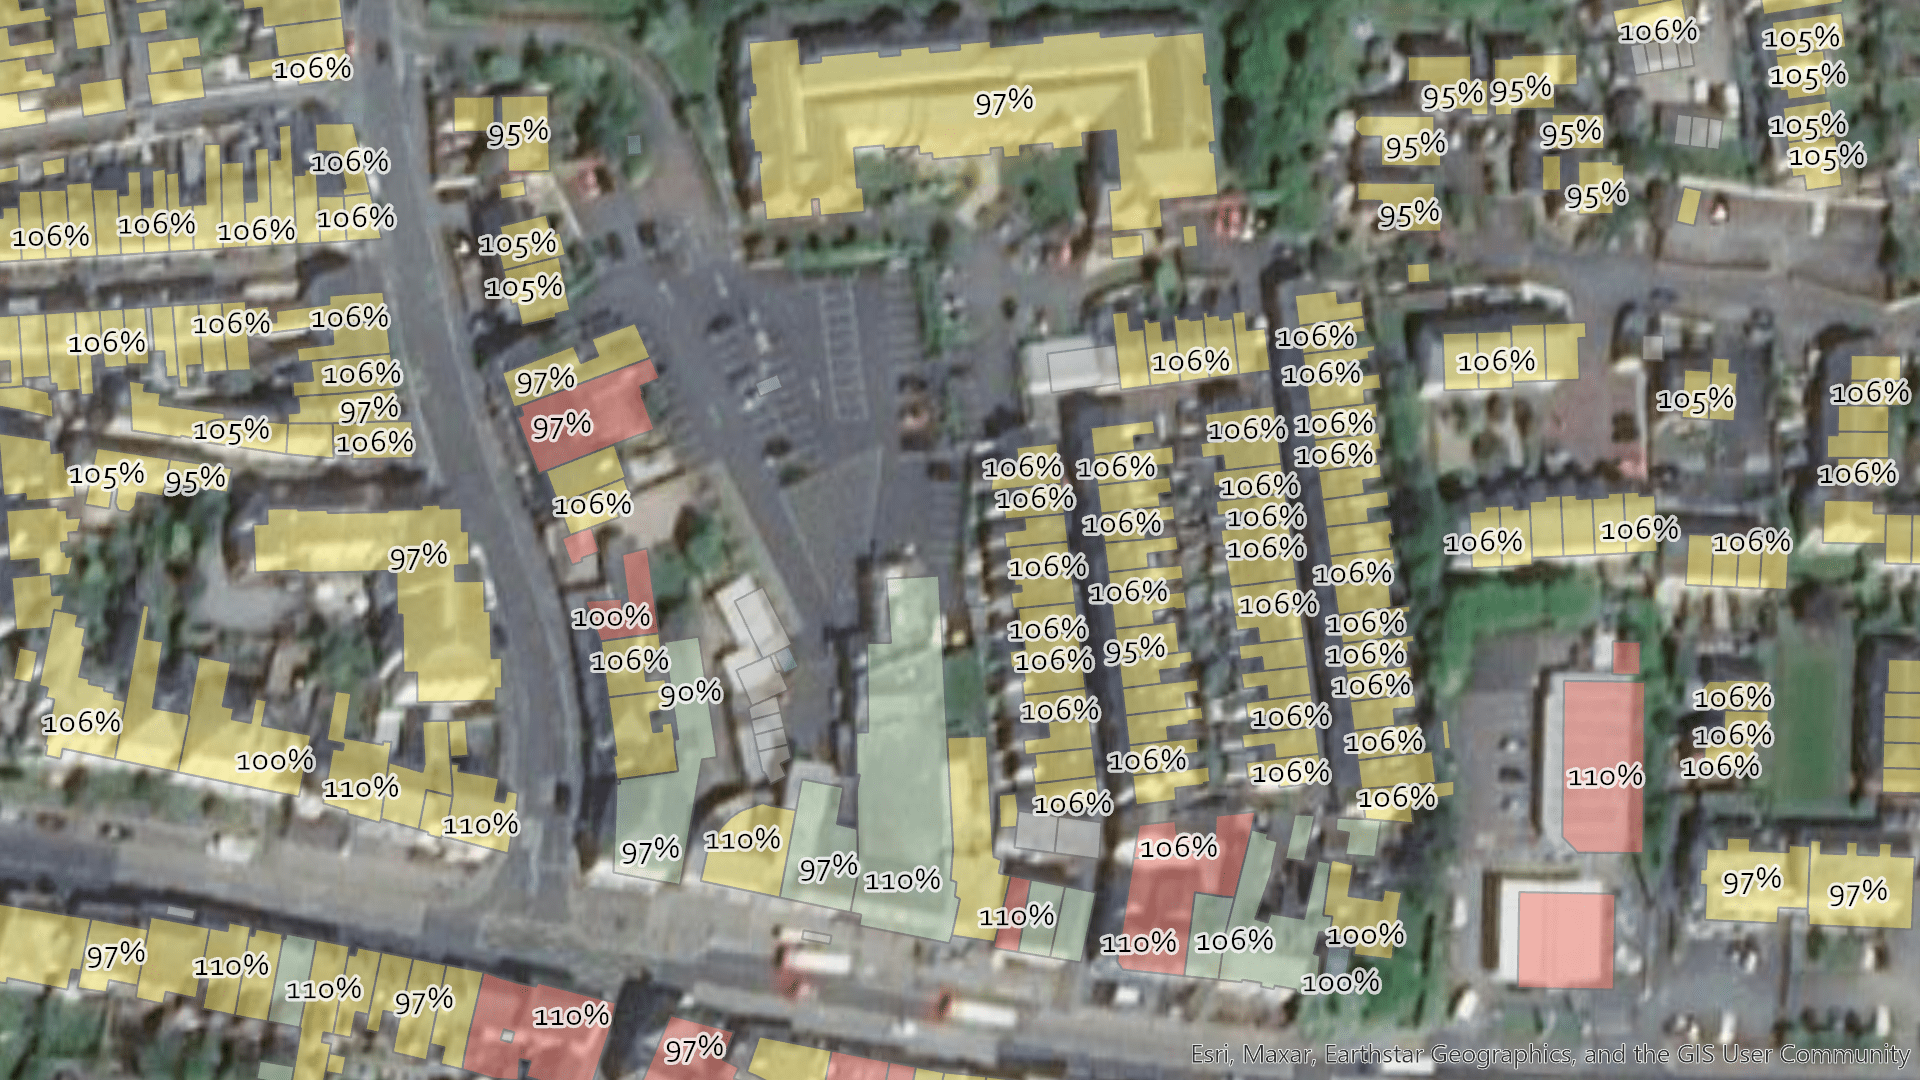
Flood Vulnerability Factors are percentage-based indicators that quantify how much more – or less – damage a specific property type is likely to suffer in a flood compared to the average. These factors reflect both the typology (e.g., detached house vs. terraced house) and, where available, the actual footprint area of the building.
This means you can now move beyond the “average residential property” assumption used in most flood risk models and gain a more nuanced view of flood risk at the address level.
At its core, the product offers two tiers of insight:
- Standard: Uses OS AddressBase property class data (e.g., detached, semi-detached, warehouse) and sector average building footprints.
- Premium: Also utilises actual building geometry from OS NGD for even greater local precision, enabling unique total damage estimates for each property.
Why it matters
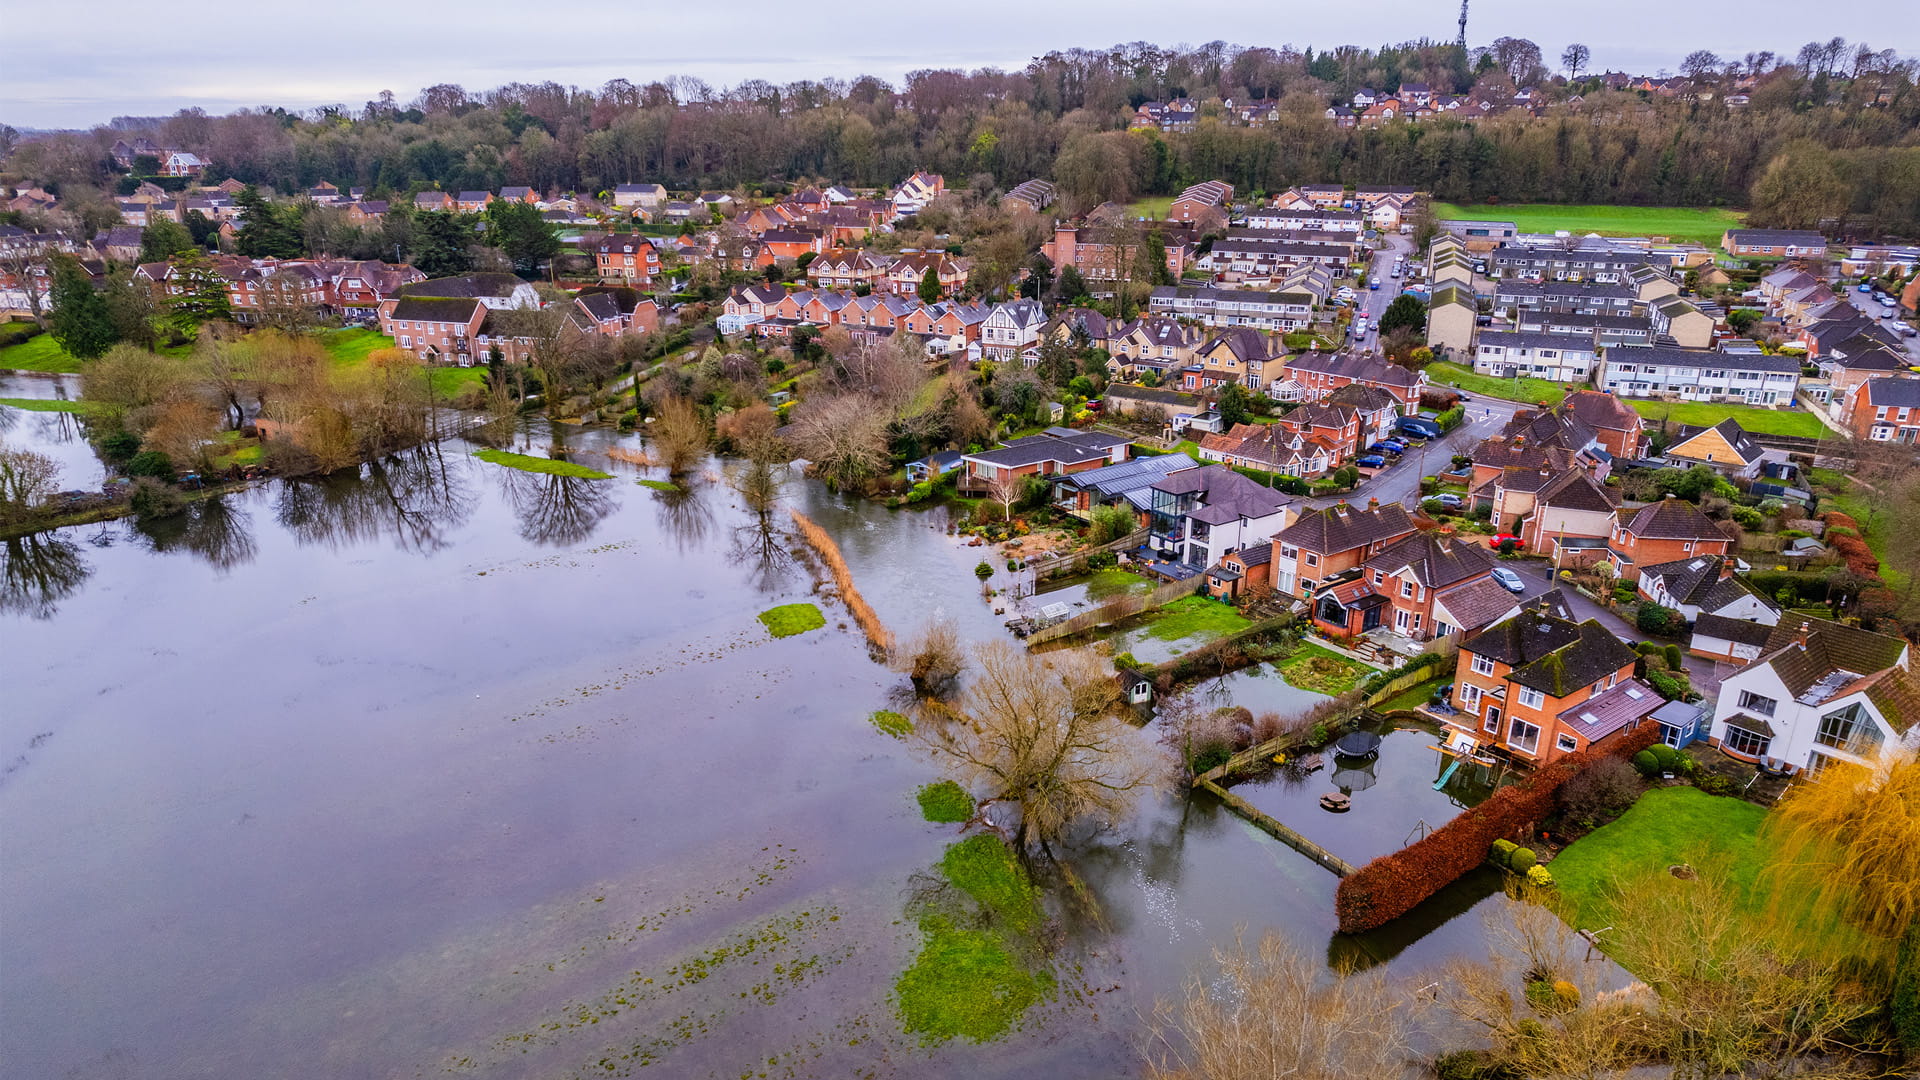
Many flood hazard models assume a standard property type for simplicity. But flood damage can vary significantly depending on the occupation, structure and size of the building. For example:
- A large, detached house may suffer ~150% of the damage that the average residential property has, even if its per-square-metre damage is slightly lower.
- Likewise, a warehouse or commercial unit may have a completely different vulnerability curve compared to a residential home.
- By incorporating both property type and building size, Flood Vulnerability Factors allow insurers and lenders to fine-tune their risk assessments and pricing strategies by augmenting existing flood model implementations.
How it works
The product is built using:
- Ordnance Survey AddressBase Premium for property classification.
- Multi-Coloured Manual learnings to define damage curves.
- FloodScore depth statistics to guide weighting for vulnerability comparisons.
- Ordnance Survey NGD Buildings for geometric precision [Premium].
We calculate vulnerability using two methods:
- Unweighted Mean: A simple relative average of vulnerability functions across all flood depth datapoints.
- Weighted Mean: A relative average of vulnerability functions, adjusted for the likelihood of different flood depths occurring based on flood type (fluvial, pluvial, coastal).
The result? A single percentage that reflects the relative flood vulnerability of each property, available per square metre or as a total damage estimate:

Who benefits most
- Insurers: Improve pricing accuracy and reduce blind spots in underwriting.
- Banks & Lenders: Assess property-level flood risk for mortgage portfolios.
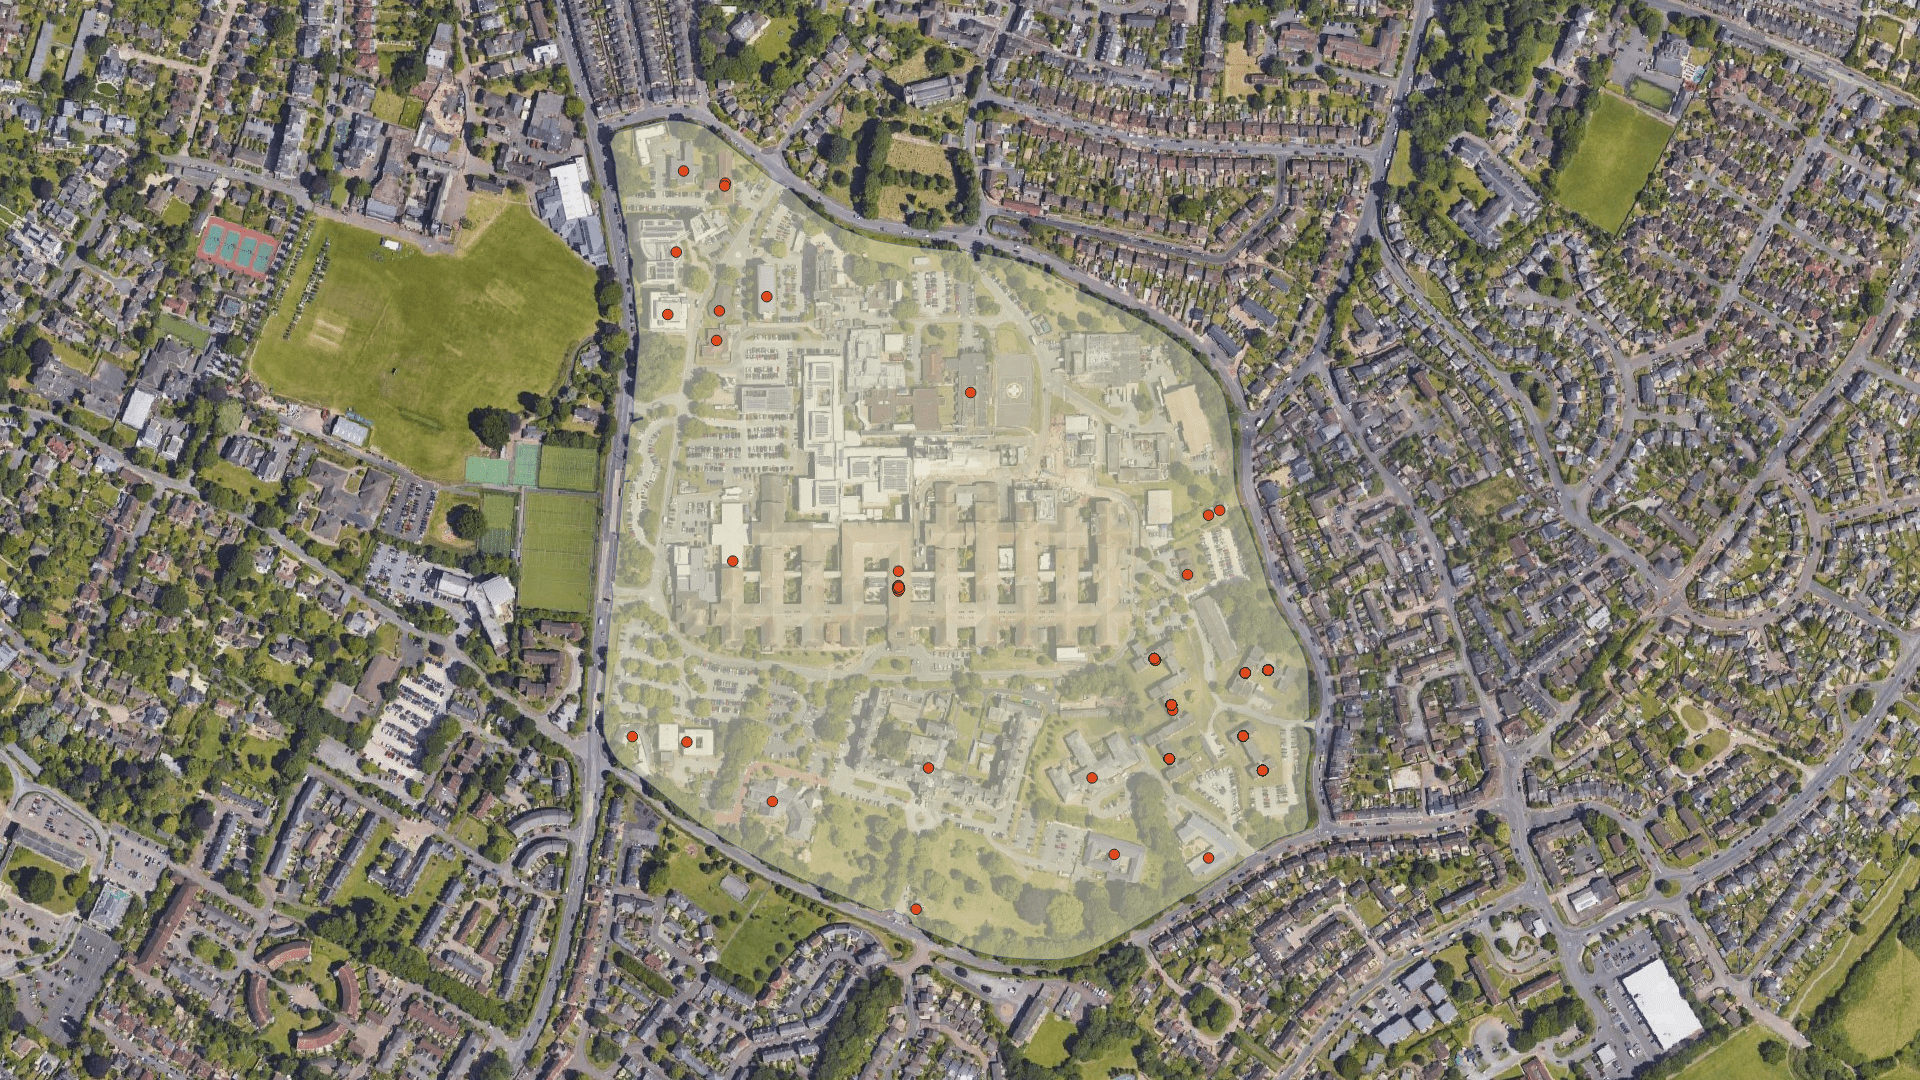
- Catastrophe Modellers: Enhance exposure modelling with more granular data.
- Risk Managers: Make smarter decisions using actuals instead of averages.
Flexible access, scalable insight
Flood Vulnerability Factors are available in both offline and integrated formats, direct from Haskoning or via your preferred reseller supplier:
- Offline delivery: Send us your UPRNs or property references, and we’ll return the vulnerability data.
- API integration: For real-time workflows, connect directly to our service and pay only for what you use.
- Whether you’re working with AddressBase Premium or NGD, we’ve designed the product to be accessible and scalable, so you can choose the level of detail that fits your needs.
Part of a bigger picture
This innovation is part of our broader commitment in 2025 to enhancing risk intelligence across the UK. It reflects our drive to move beyond hazard and focus on vulnerability and exposure modelling, giving you the tools to make better decisions, faster.
Ready to upgrade your flood risk assessments?
Get in touch today to learn more, request a demo, or explore how Flood Vulnerability Factors can support your portfolio with smarter, property-level insights.
Discovermore
Request sample data to see how climate risk data analytics can help your business
Read more about our latest innovations
 Water
WaterBoost property risk insights with our new site-link service for enhanced site visibility
 Digital
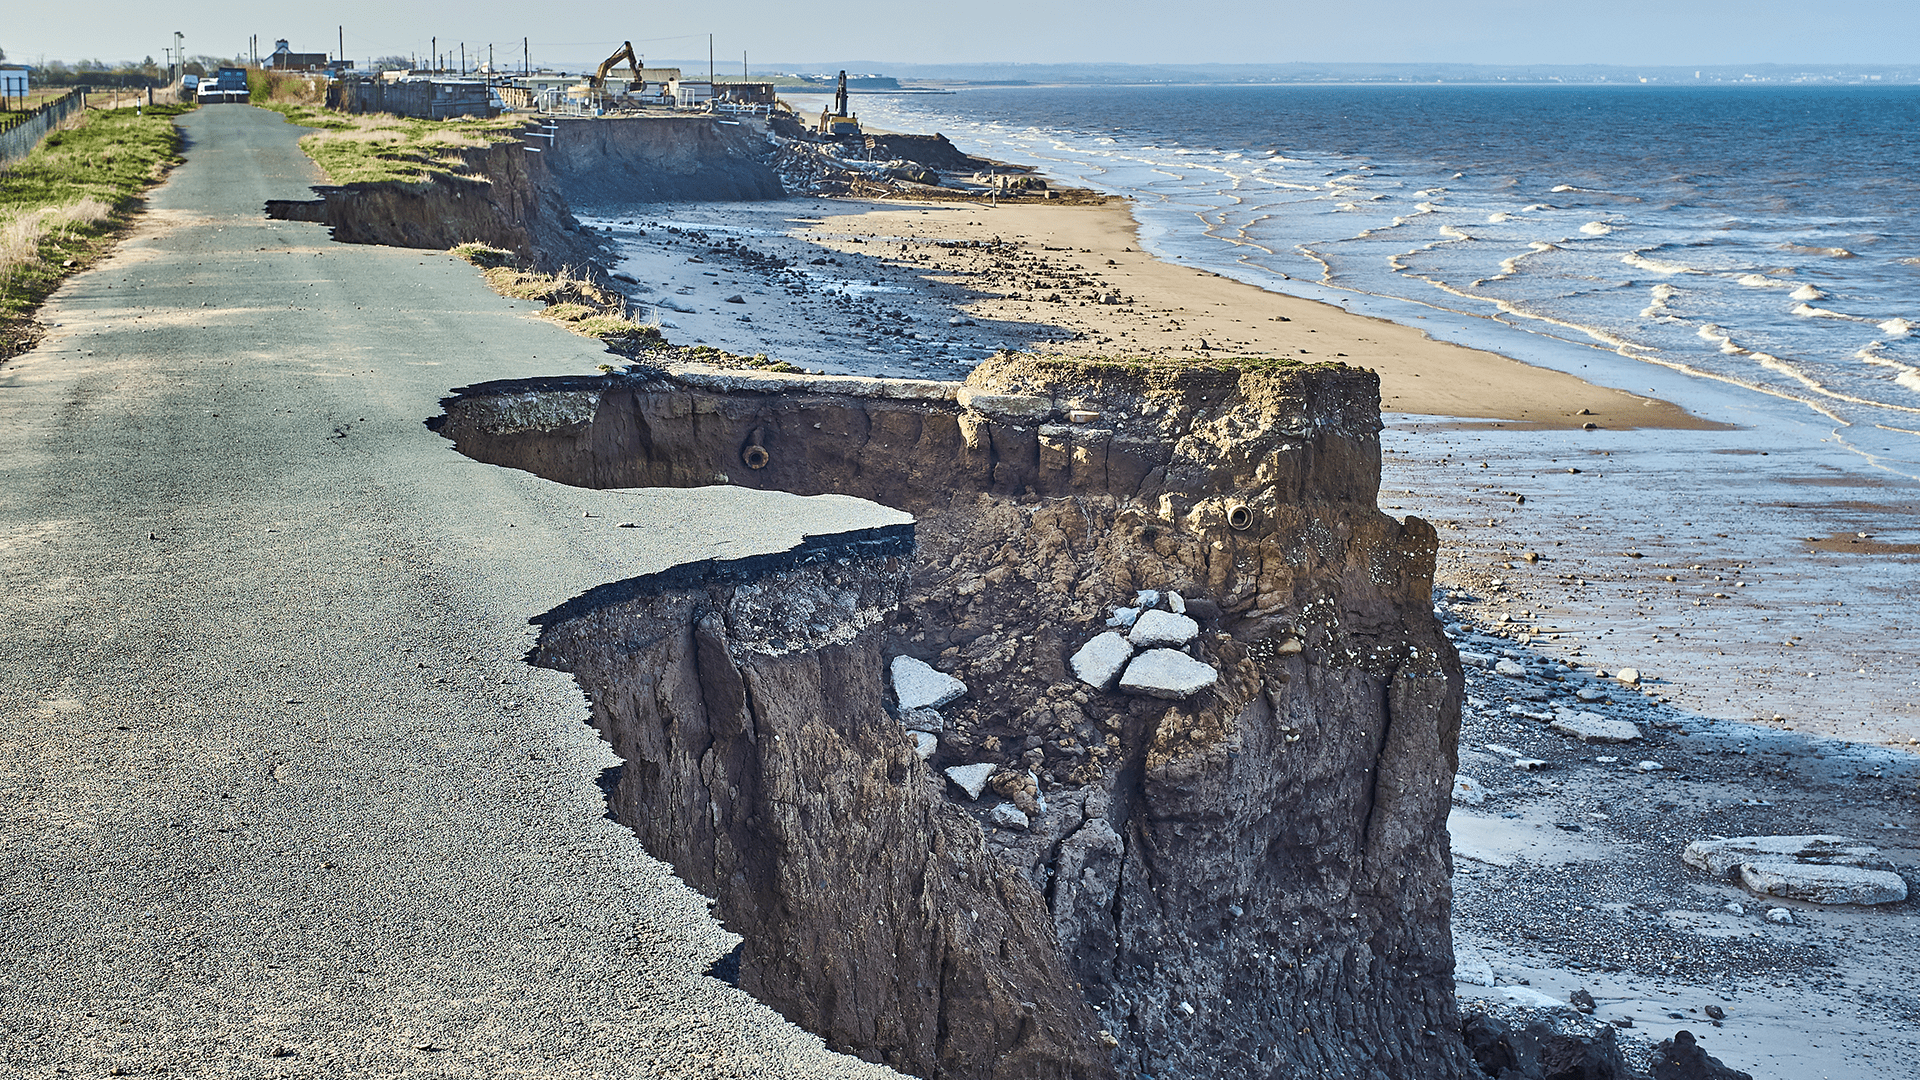
GB Erosion Score the future of coastal risk intelligence
 Water
WaterMachine learning and the Fire Weather Index for wildfire danger prediction
 Digital