FloodMap Scotland: the most up-to-date, high resolution flood risk data for Scotland
Get sample dataGet sample data

IsisFigueiredo Procter
The need for high quality flood risk data in Scotland
The Scottish Environment Protection Agency (SEPA) identifies flooding as “the most serious climate related threat” facing the country, with impacts already being felt across communities from the Borders to the Highlands. From April 2024 to April 2025, a total of 662 flood warnings and alerts were issued in Scotland. For example, in late December 2024, severe flooding across northwest and central Scotland, including the Speyside and Cairngorms areas, followed intense rainfall, leading to widespread impacts on communities, transport and local infrastructure.
According to the National Flood Risk Assessment 2025, flood damage in Scotland is estimated to cost nearly £500 million per year. Additionally, around one in eight properties are currently at medium risk of flooding; a number expected to rise by 58.5% by 2100 due to climate change.
Understanding flood risk ensures that resources and interventions are focused where they best protect communities. It also supports long-term planning by shaping infrastructure choices, emergency preparedness and future investment. Accurately assessing property flood risk in Scotland for decision-making requires current, granular data with asset-level precision.
That’s why Twinn is delivering a comprehensive remodel of Scotland as part of our UK FloodMap development roadmap, scheduled for release in Q3 2026. This upgrade will make Twinn’s UK FloodMap the most detailed and up-to-date flood risk data available for Scotland, incorporating the latest available LiDAR terrain data, land use / land cover and enhanced hydrological inputs. It will give every end user, from insurers to planners, a stronger foundation for confident and well-informed decision-making.
What’s new in the upcoming upgrade
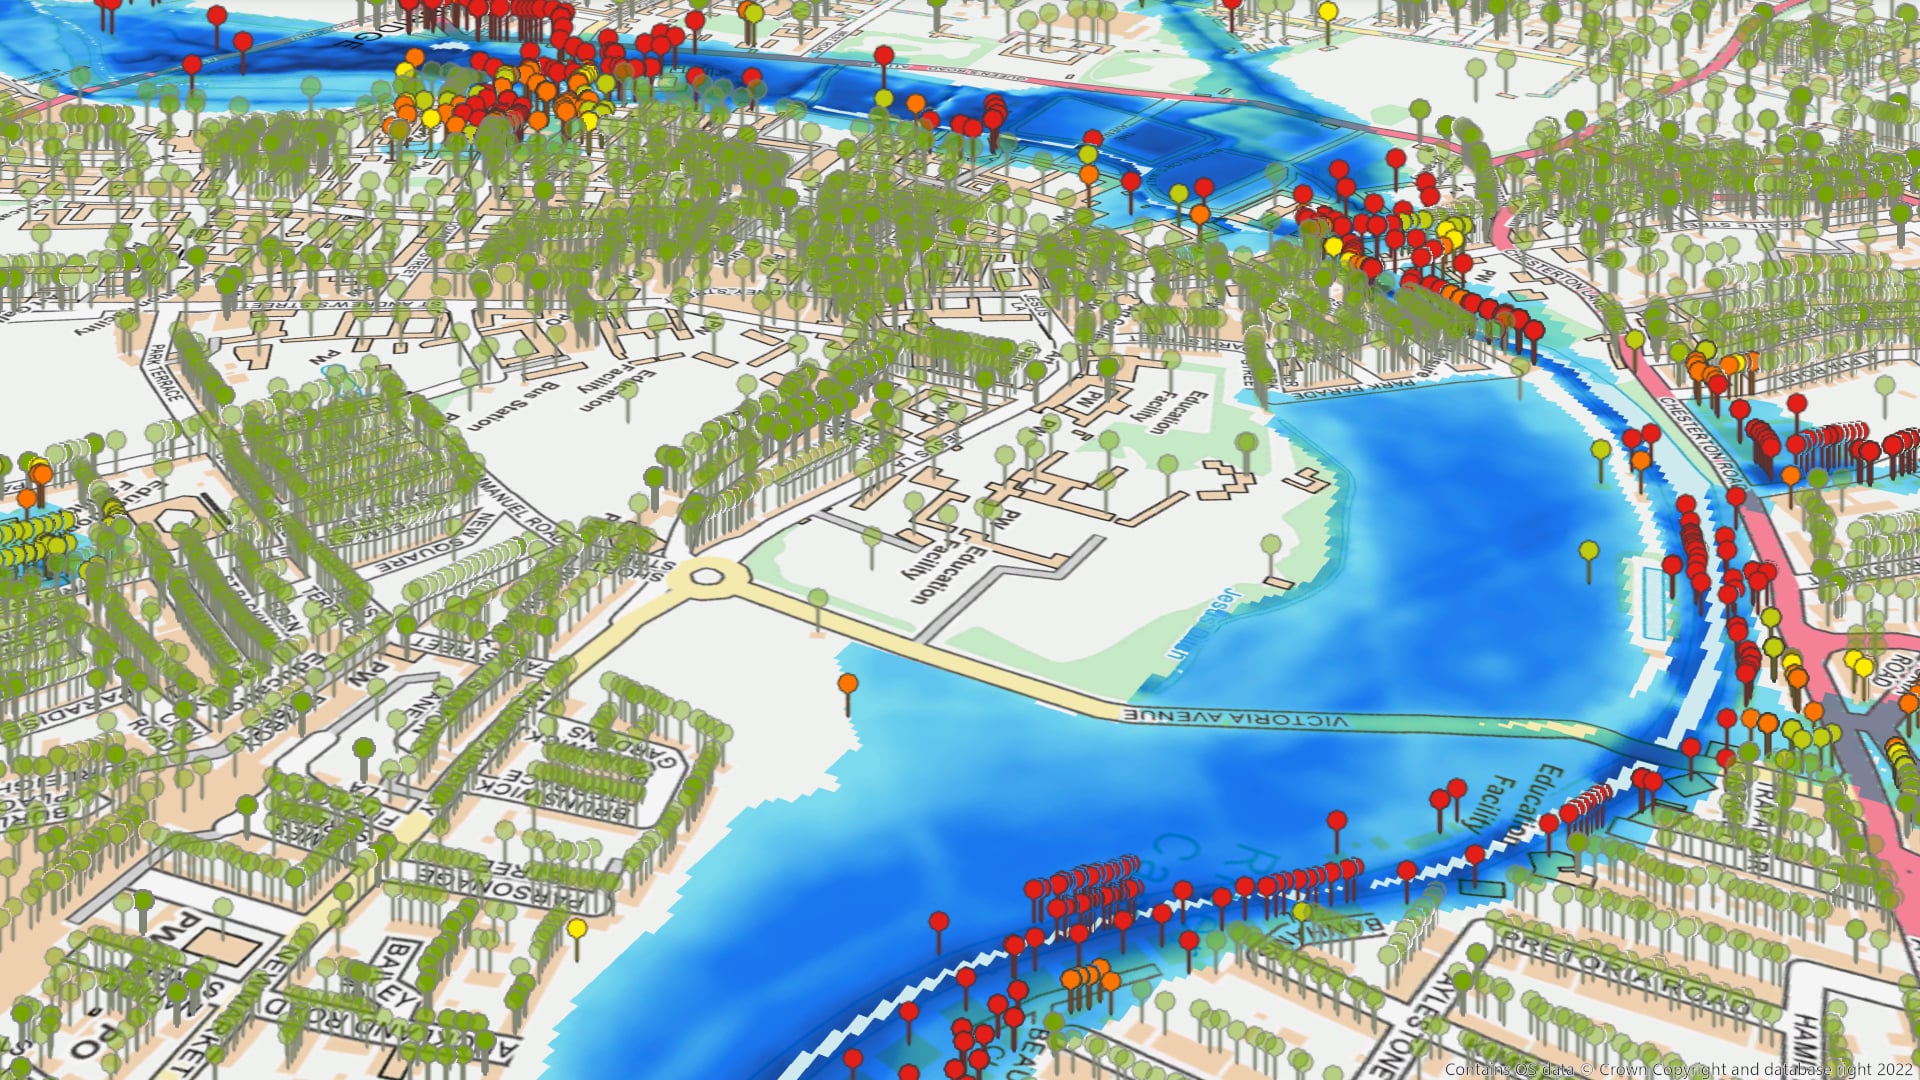
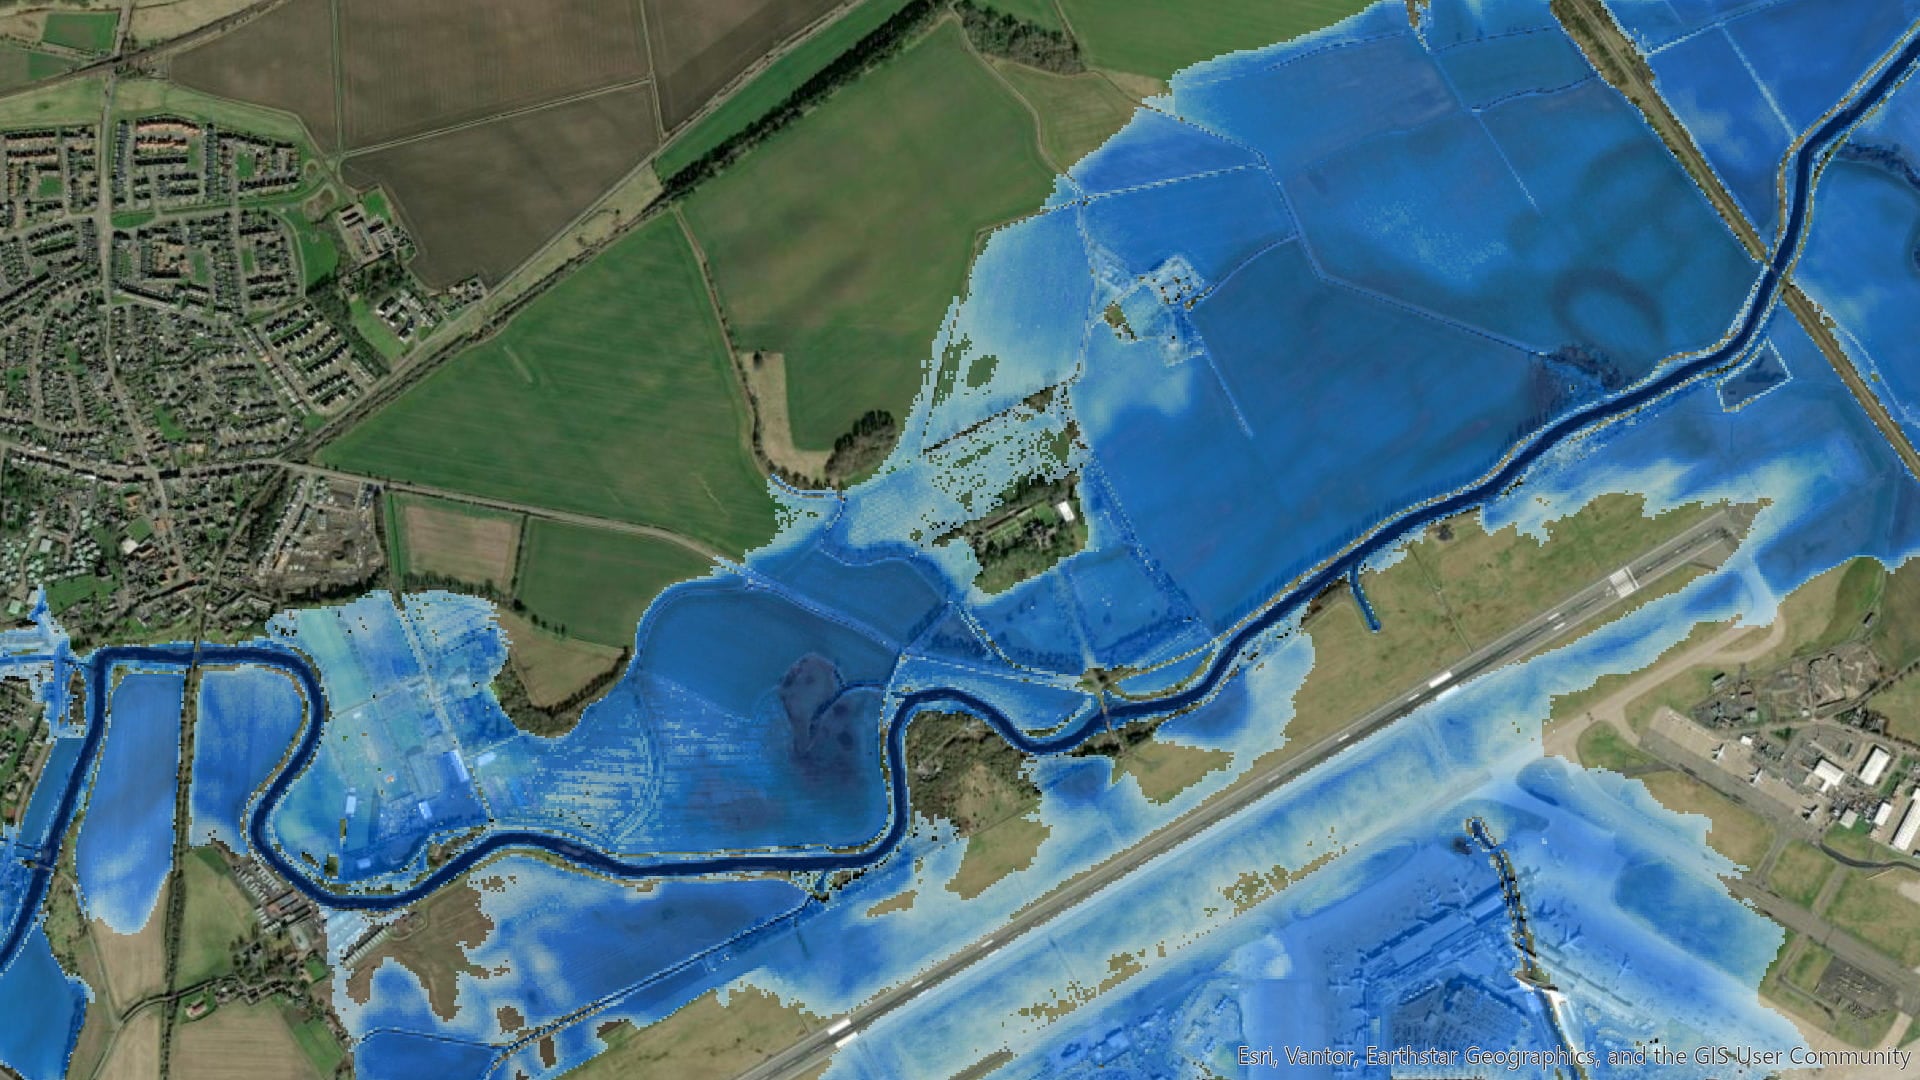
Our Scotland upgrade leverages the most detailed, high-precision data available at national-scale to simulate flooding from three major sources: pluvial (surface water), fluvial (riverine) and tidal (coastal). The model integrates localised input data across 80,000 km² at a 5-metre spatial resolution, capturing Scotland’s diverse landscape, to provide high-resolution flood depths and extents.
The upgrade will include all currently available LiDAR data for Scotland, increasing the total land area coverage to 50%, capturing approximately 90% of all properties. High quality topographic data is vital for flood modelling as it captures subtle height changes that affect how water flows during heavy rain or flooding. With centimetre-level detail, Scotland’s national LiDAR programme is already transforming terrain data across the country, giving modellers a much clearer and more accurate foundation to work from. By expanding LiDAR coverage, the Twinn update will build on this national effort and produce more realistic flood depths, flow paths and property-level insights than ever before.
As well as LiDAR, using the latest authoritative inputs from the Centre for Ecology & Hydrology and Ordnance Survey ensures the model is built on reliable, nationally recognised datasets. These sources provide the newest hydrological and high-quality mapping data, which together create a more accurate view of the complex interactions between the conditions and processes that lead to flooding.
Advanced modelling that applies spatially variable infiltration and drainage allowances (tuned to local land use and soil types) helps the model behave more like real ground conditions. This reduces the risk of overpredicting floods in areas that drain quickly and underpredicting in places where water is more likely to accumulate, resulting in more realistic flood depths and flow paths.
What it means for your decisions
The Twinn Scotland upgrade to UK FloodMap offers a major improvement in the quality and precision of flood risk insight, giving insurers, lenders and public-sector organisations a much clearer understanding of flood risk.
For insurers and Managing General AgentsUnderwriting can be based on more granular asset-level information.
High-resolution LiDAR helps distinguish real risks from noise, which reduces false positives and enables more selective exclusions. Such level of clarity can support more confident pricing decisions and improve the ability to balance risk across a portfolio.
For Mortgage lenders
Similarly, with better flood risk intelligence at property-level, lenders can strengthen their approval processes and understand long-term exposure of the assets they finance. Improved detail helps avoid misclassification (whether that’s overstating or understating the risk) and supports more defensible decisions across the full lifecycle of a loan book.
For consultants and local authorities
Understanding flood pathways allows teams to target interventions where they have the most impact and reduce uncertainty at early design stages. This is key when developing resilience measures, upgrading infrastructure networks, or planning for new developments.
Under the hood: data, modelling & quality assurance
LiDAROur approach to flood modelling works by simulating how water moves across the landscape using a 2D hydraulic engine. It treats the terrain as a grid and calculates how rainfall, river flows and coastal surges move from one cell to the next. This method relies on the quality of input data, such as underlying terrain data. This is because even small changes in ground height can determine whether water escapes down a channel, pools behind an obstacle, or diverts towards a property. That’s where LiDAR makes a significant difference. Unlike lower accuracy elevation datasets that smooth over details, LiDAR captures the shape of the land with centimetre-level precision, picking up kerbs, dips, embankments and subtle contours that strongly influence flow routing. When such high-resolution elevation data is fed into the hydraulic model, it dramatically sharpens predictions; water follows more realistic pathways, flood depths become more accurate, and the resulting maps better reflect what would happen on the ground during extreme weather. The result is a modelling framework that behaves far more like the real world, giving decision-makers insights they can rely on.
Infiltration and Drainage
Flood models that use simple assumptions about rainfall runoff and / or drainage risk can underrepresent the impact of different ground surface types. Such approaches can work at a broad catchment scale, but can struggle to capture what happens on individual streets, where surfaces and drainage performance can vary from one place to the next.
Applying advanced spatially variable infiltration and drainage allows for a more realistic representation of how water behaves during real flood events, capturing how differences in land cover and soil type controls whether water ponds, infiltrates, or flows towards properties. As a result, the model produces much more robust surface water behaviour.
The Revitalised Flood Hydrograph Model (ReFH) is a rainfall-runoff model widely used in the UK for estimating design flood events. We have used this to convert rainfall into effective runoff by accounting for soil infiltration in pervious (natural) areas. This approach considers both how wet the ground already is and the physical characteristics of each catchment.
Runoff is estimated differently in urban areas to account for the impervious nature of the ground surface and to reflect the role of surface water drainage systems.
How to assess flood risk in Scotland — a quick checklist
Product summary
| Twinn Scotland FloodMap | |
| Resolution | UK FloodMap Scotland is modelled at 5 metres and offers high precision detail needed for reliable flood risk insights. |
| LiDAR coverage | The Scotland update uses all available national LiDAR terrain data, supplemented with photogrammetry where this isn’t available. |
| Update frequency | UK FloodMap is updated annually, incorporating enhanced input data such as topography data (e.g. LiDAR), landcover and / or hydrology data. This ensures the flood model evolves alongside the latest available inputs datasets. |
| Modelling sophistication | Twinn’s modelling uses in-house 2D hydraulic software to simulate realistic surface water pathways and flood depths. |
| Validation | Flood model validation is performed to assess the reliability of simulated outputs, which includes comparing outputs with observed data; benchmarking with other models; and reviewing model outputs against the expectations of subject matter experts and/or local knowledge. |
| Decision-readiness | Twinn’s flood data is built for quick adoption, with flexible delivery options that fit directly into workflows. Organisations can access the Scotland update (and other hazard data) through APIs, GIS map layers, tabular/database files, or via Twinn’s web applications. This makes integration straightforward. Sample data and onboarding support are provided, ensuring teams can evaluate the data easily and begin using it with minimal setup. |
Getting started
Twinn by Haskoning provides high‑resolution flood and climate risk data designed to be accessed easily and used directly and within analytics platforms as needed
Twinn data (including the Scotland updated UK FloodMap) can be accessed in several ways, depending on the requirements of end users.
| APIs | Enable dynamic queries by address or coordinates, making them well suited to automated risk screening and direct system integration. |
| Map tiles and GIS layers | Can be overlaid in GIS software such as QGIS, ArcGIS, or web‑based mapping frameworks, giving a clear visual view of flood depth, extent and likelihood. |
| Flat files (geospatial or tabular) | Support bulk analysis and integrate easily with GIS tools, Python, R, SQL and cloud environments. |
These options make it easier to bring Twinn data into existing analytics and workflows. The flexibility in access methods allows teams to choose the format that best fits their technical setup and decision‑making needs.
Organisations interested in using Twinn data can request a demo, ask for a sample dataset, or speak with a specialist to discuss their requirements and identify the most appropriate access route. The data can also be accessed via our extensive reseller network.

Discovermore
Request sample data to see how climate risk data analytics can help your business