Hazard Maps in brief
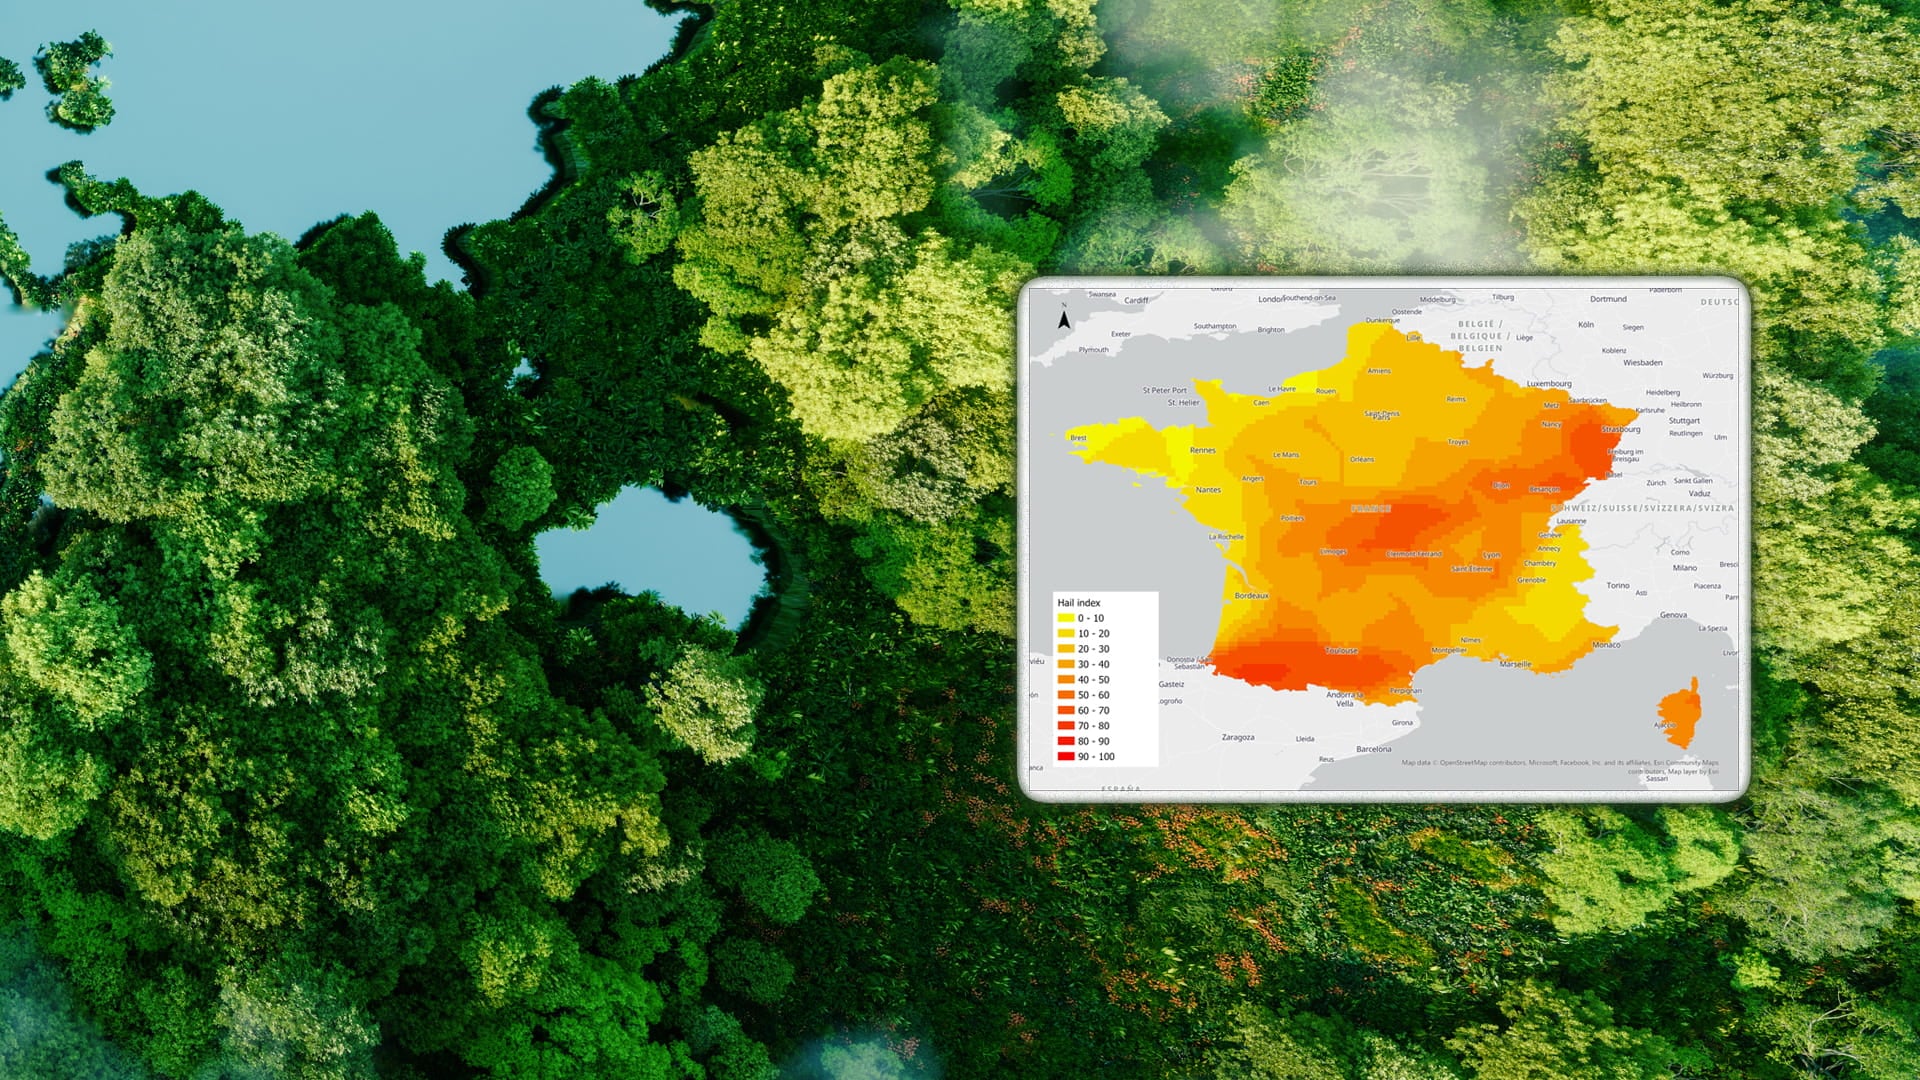
Granularity and precision
Delivering the highest resolution, market leading data where available, modelled in-house by our data experts.
Customisable output
We can provide data at any desired resolution, down to individual address or site location.
Detailed insights
Provided through the hazard map attribution relating to hazard frequency and severity.
Multiple perils
Our hazard maps include data for 19 different peril types.
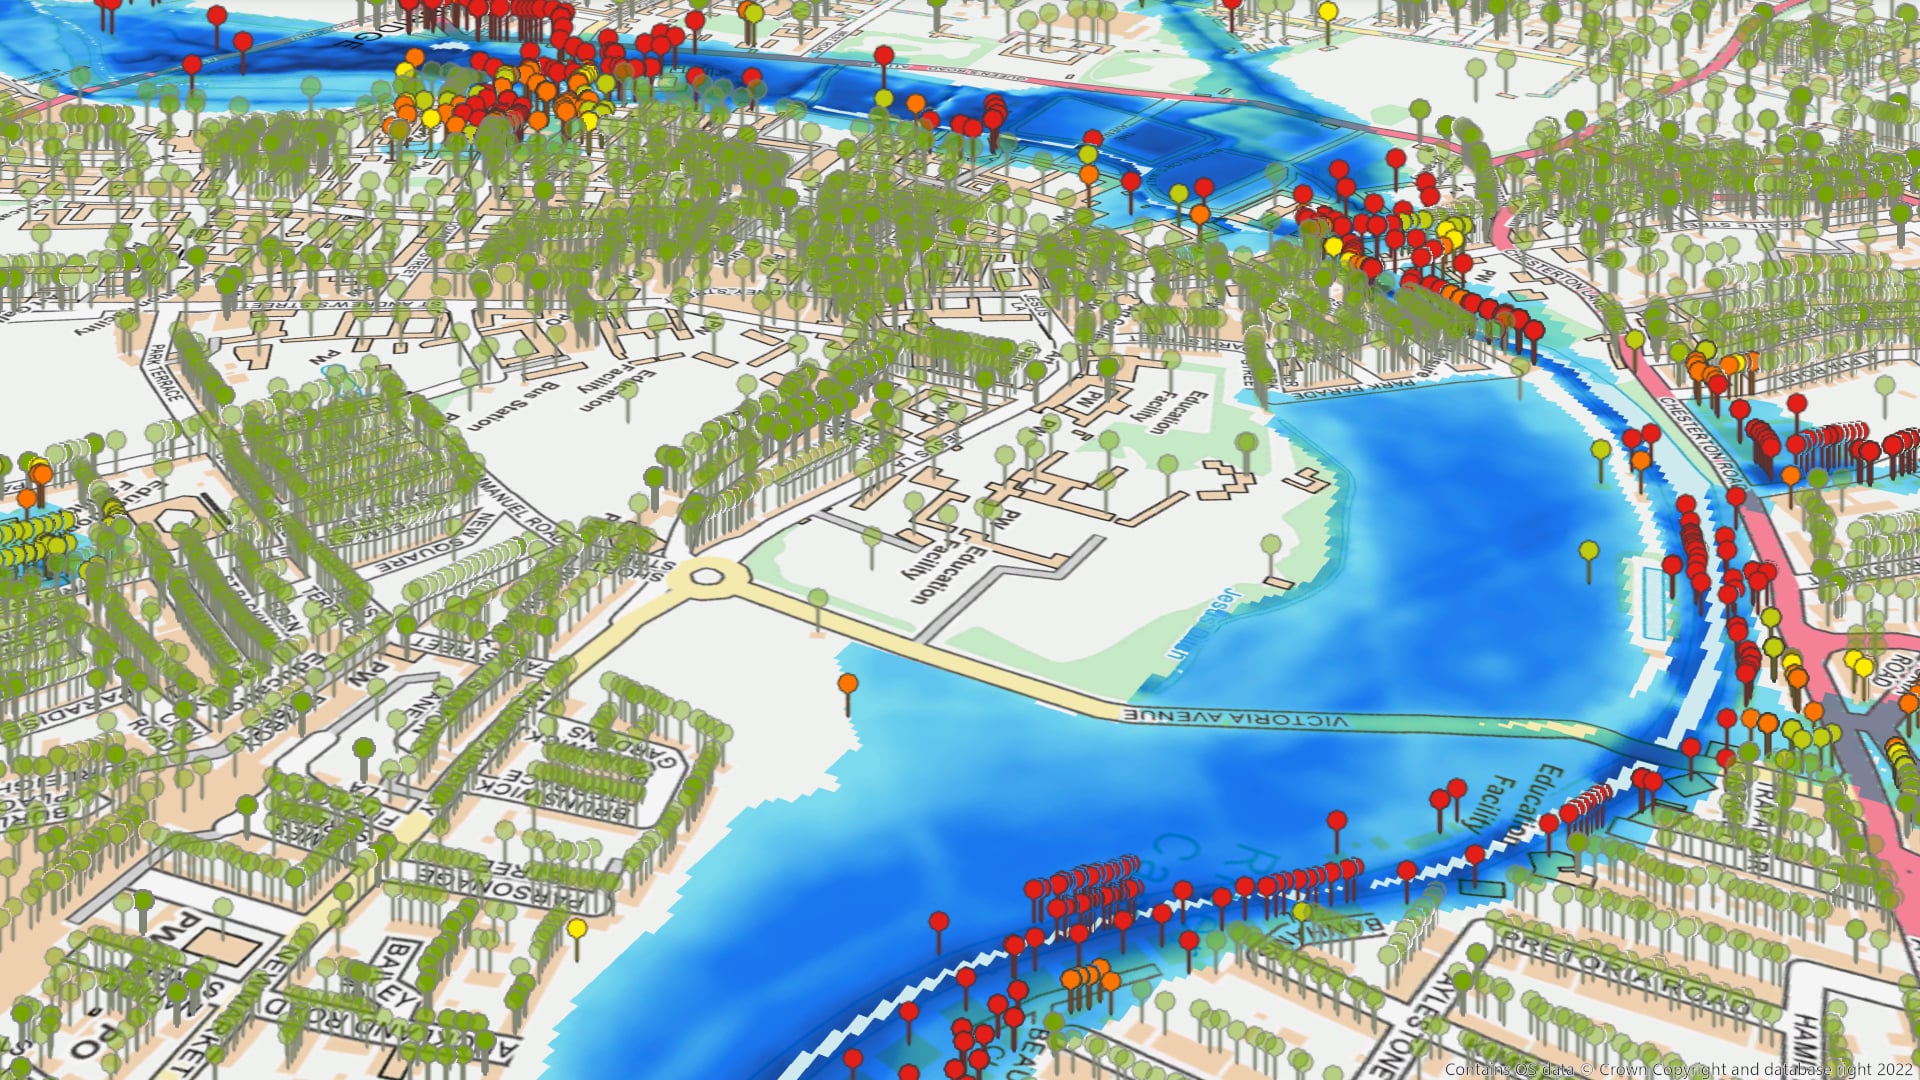
Visualise, assess, and understand potential risks from natural hazard events
Our global hazard data is used to visualise, assess, and understand potential physical climate-related risks. We are able to generate hazard maps or hazard risk datasets for all countries using our:1. Proven simulation software
2. High quality, high resolution topological data
3. Our leading hazard experts
4. Strong data and academic partnerships
Twinn by Haskoning Hazard Map data is provided at the highest possible resolution in each country, for every hazard. This enables a comprehensive understanding of specific hazard variables.
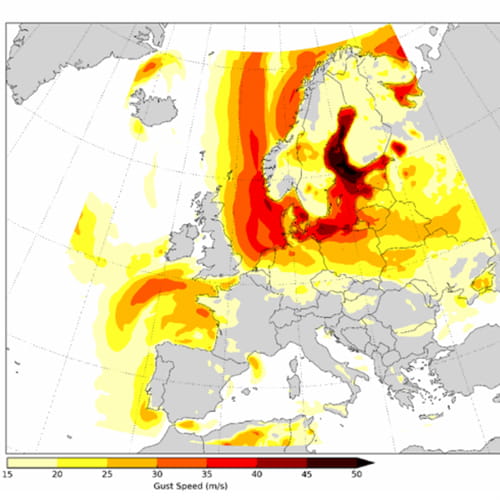
This hazard map shows a sample of wind data modelled for a synthetic event
The more accurate picture of risk we now have will enable us to decide at the individual property level where we do and don’t want offer insurance cover and ensure that we are only taking on acceptable risks.
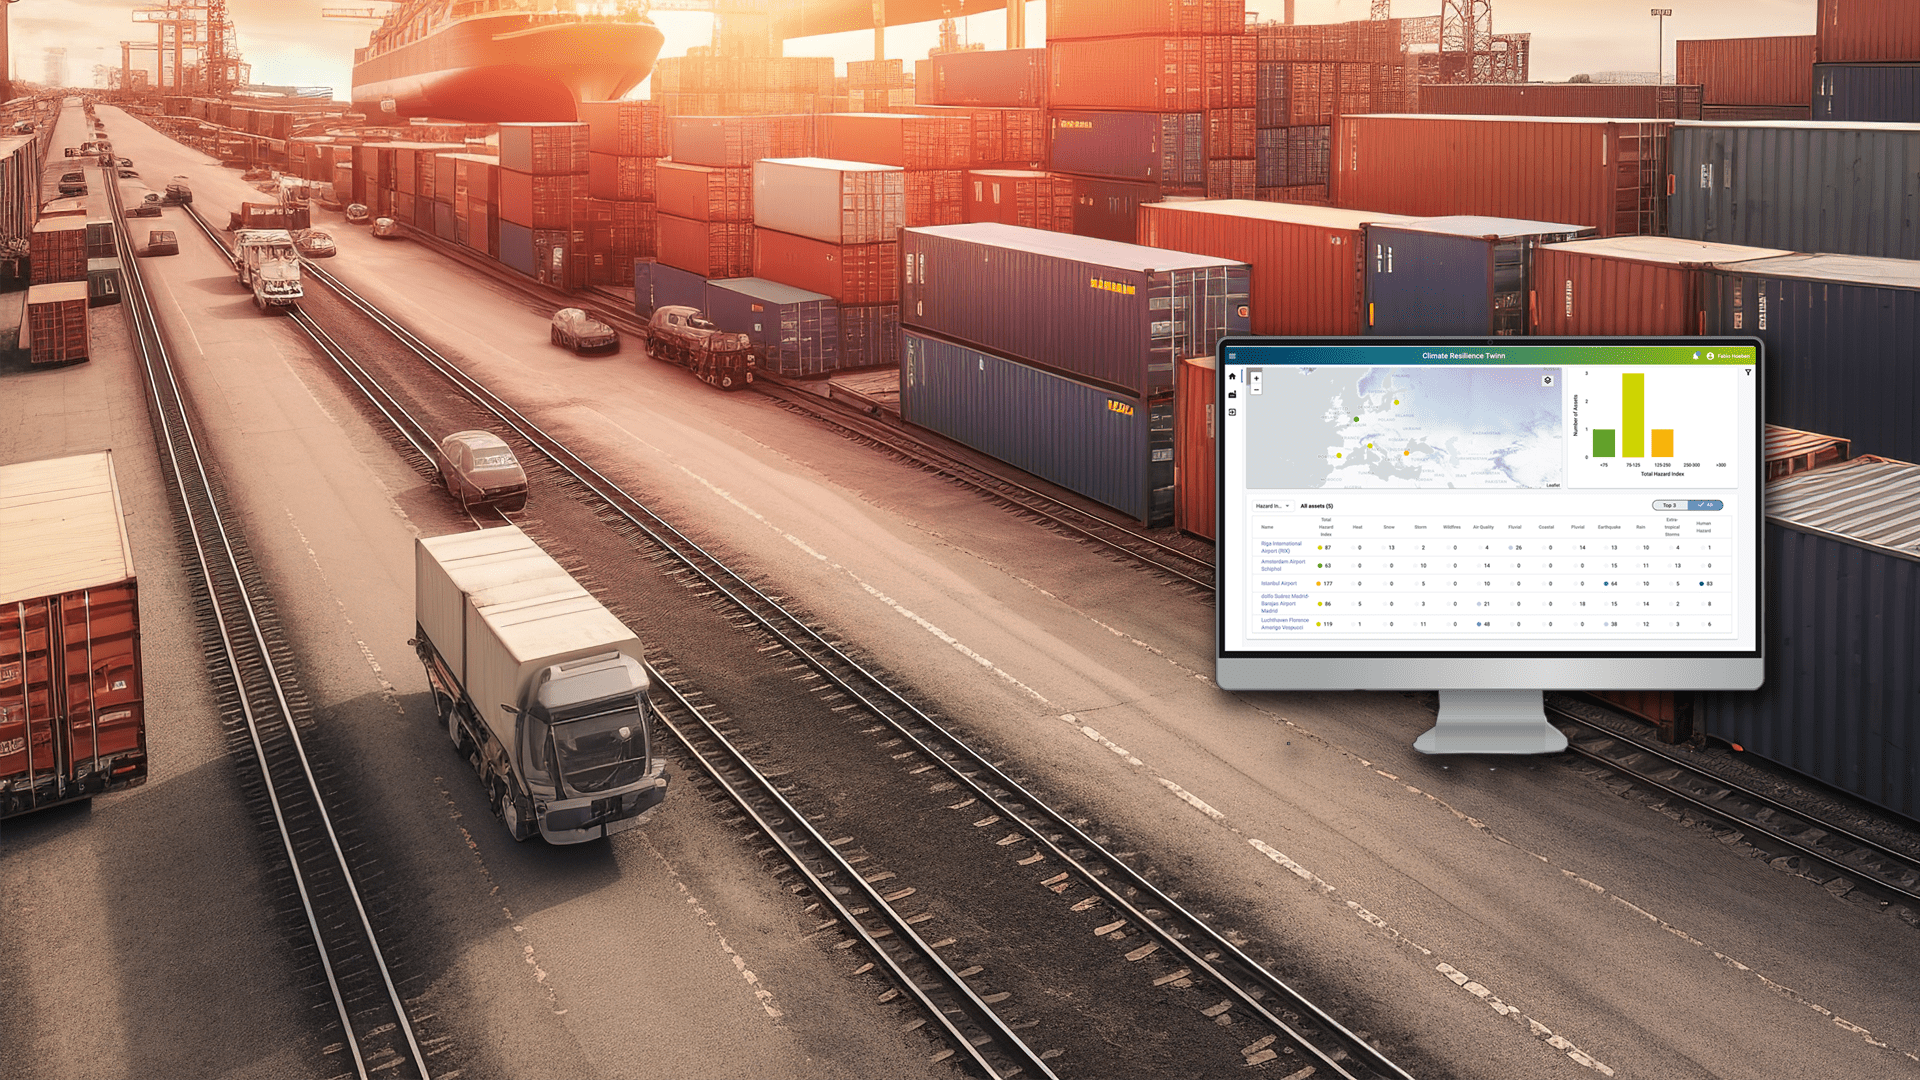
Easy ways to access our data
Integrate into compliance, live business environments, and planning and risk management processes.
Find out how